So, I don't want to go into how horrible the network is or how they wear their bias on their sleeves while denying bias with their mouths.
I just want to point out a great potential lesson on visualizing data. It's a topic that should come up in most composition classrooms, and it's always nice to have a current event to drive a lesson home.
 The story of this graphic is covered on the Huffington Post.
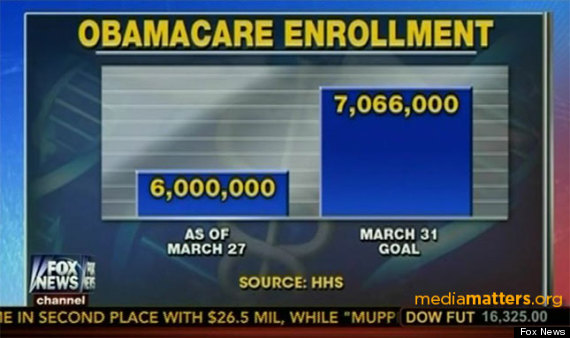
The basic story is simple: Fox News was reporting on enrollment in the Affordable Care Act, and they used this graph to demonstrate the numbers.
Some people on the internet noticed the scale on the graph made no sense at all. People declared the graph a clear attempt to make the numbers look a certain way.
The swift and angry response to that graph prompted Fox News to apologize for the mistake and show a version of the graph that was scaled correctly.

NOTE: It is a little weird that the source for these numbers changed, but I'm not sure how I would turn that into a teaching moment.
No comments:
Post a Comment